Overview
My daily commute from West Vancouver to UBC is influenced by:
- Bridge congestion
- Traffic choke points
- Time-of-day patterns
- Campus-specific traffic flows
Leaving with even a few minutes difference can lead to large differences in total travel time. In the interest of minimizing how much time I spend sitting in traffic and trying to optimize my departure time to be as efficient as possible without being late, I decided to take on this project. The objective was to build a system that answers:
“If I left right now, how long would my commute take?”
To accomplish this, I built: Sea-to-School Forecasting. A full end-to-end commute prediction system built to estimate travel time from West Vancouver → UBC using:
- A custom ESP32 embedded device for GPS data collection
- A segment-based statistical algorithm
- A c-based prediction engine
- Real-time drive duration prediction outputs
System Flow
- ESP32 device logs a commute
- Data is saved to SD as
.csv - C pipeline parses + cleans it
- Segments are computed
- Statistics updated
- Prediction engine outputs total commute time
Project Structure
Arduino
├── Hardware               # ESP32 embedded system with GPS and SD card breakout boards.
└── Firmware               # Converts NMEA sentences to data, and stores on SD card

C Data Processing Program
├── esp_data.cpp           # Embedded firmware to capture/sense data
├── esp_data.h             # Header definitions for firmware
├── gpsdata.txt            # Raw data collected from sensors
├── main.cpp               # Main firmware logic
├── prediction.cpp         # Prediction algorithm implementation
├── prediction.h           # Header for prediction logic
├── traversals_output.txt  # Output of traversal time analysis
├── predictions_output.txt # Output of predicted commute durations
├── segments_map.html      # Map visualization of route segments
└── visualize_segments.py  # Python script to visualize segments
Repository 📂
Full source code:
Github Link
Embedded Device & Firmware
Hardware
- ESP32 DevKit
- NEO-6M GPS module
- SD card module
- Custom breadboard wiring
Features
- High-frequency GPS logging
- Buffered SD writing
- Automatic file rollover
- Handling for temporary GPS loss
Example Firmware Snippet
  if (dataFile) {
    // Log location
    if (gps.location.isValid()) {
      dataFile.print(gps.location.lat(), 6);
      dataFile.print(",");
      dataFile.print(gps.location.lng(), 6);
      dataFile.print(",");
    } else {
      dataFile.print("INVALID_LAT,INVALID_LNG,");
    }
Segment of Arduino firmware which decodes GPS NMEA sentences into longitude and latitude
 Photo of the ESP32 + GPS + SD hardware mounted on the breadboard.
Major Fix
I spent weeks debugging a seemlingly unfixable issue, where I could not get my SD card reader to initialize my SD card. I went through various stages of trying to debug the wiring, code, and SD card, before concluding the unit must be the issue. It was, and a new SD card reader worked immediately upon installation.
Additional Note
The GPS must lock on to 3 satellites before it can output raw nmea sentences, but this takes time, upwards of 5 minutes if inside or out of direct view of the sky. To improve the robustness of this system, a small battery should be included to keep the GPS powered when the ESP is turned off, so that it never loses its gps lock, and can therefore boot significantly faster. This idea was implemented on a future project, my telemetry pcb, to ensure the vehicle can output gps data immediately.
Data Processing Pipeline
Raw data log example:
INVALID_LAT,INVALID_LNG,0.00,2025,10,16,15:32:48
INVALID_LAT,INVALID_LNG,0.00,2025,10,16,15:32:49
INVALID_LAT,INVALID_LNG,0.00,2025,10,16,15:32:50
INVALID_LAT,INVALID_LNG,0.00,2025,10,16,15:32:51
49.271975,-123.166598,2.85,2025,10,16,15:32:52
49.271984,-123.166585,0.13,2025,10,16,15:32:53
49.272020,-123.166607,0.39,2025,10,16,15:32:54
49.272034,-123.166613,0.65,2025,10,16,15:32:55
49.272047,-123.166614,3.22,2025,10,16,15:32:56
49.272064,-123.166610,4.57,2025,10,16,15:32:57
49.272047,-123.166590,2.87,2025,10,16,15:32:58
49.272052,-123.166584,0.37,2025,10,16,15:32:59
49.272049,-123.166584,0.39,2025,10,16,15:33:00
Raw logs are stored as CSV files on the SD card. The data pipeline:
- Loads raw GPS logs
- Removes invalid points
- Smooths jitter
- Detects segment boundaries
- Produces per-segment traversal durations
Example Segment Extraction Code
		// Read each line from the file, and store the data in the ESPData array
		while (fgets(buffer, sizeof(buffer), filepointer) != NULL) {
			if (count >= MAX_ESP_DATA_POINTS) {
				printf("Maximum ESP data points reached. Some data may not be read.\n");
				break;
			}
			int n = sscanf(buffer, "%[^,],%[^,],%lf,%[^,],%[^,],%[^,],%[^\n]",
				latStr,
				lonStr,
				&tempSpeed,
				yearStr,
				monthStr,
				dayStr,
				timeStr
			);

			// Check if the line was parsed correctly by confirming the number of items read
			if (n != 7) {
				printf("Error parsing ESP data line: %s\n", buffer);
				continue; // Skip malformed lines
			}

			// Confirm validity of parsed data
			if (strcmp(latStr, "INVALID_LAT") == 0 || strcmp(lonStr, "INVALID_LNG") == 0 || strcmp(yearStr, "INVALID_DATE") == 0 || strcmp(timeStr, "INVALID_TIME") == 0) {
				printf("Skipping invalid ESP data point: %s\n", buffer);
				continue; // Skip invalid data points
			}
This code produces an output file, which contains the time for each segment for each drive as a csv entry for later analysis.
9,247,2025-10-16,08:32:52
10,317,2025-10-16,08:37:04
11,179,2025-10-16,08:42:27
12,96,2025-10-16,08:45:33
6,41,2025-10-17,07:40:43
7,58,2025-10-17,07:41:28
8,113,2025-10-17,07:42:29
9,136,2025-10-17,07:44:27
10,350,2025-10-17,07:46:47
11,112,2025-10-17,07:52:44
12,93,2025-10-17,07:54:39
1,115,2025-10-20,07:19:58
Example outputs from segment extraction code (Segment #, Traversal Time, Data, Start Time)
Route Segmentation
The commute is split into logical segments such as:
- Park Royal → Lions Gate Bridge
- Start of bridge → Stanley Park causeway
- Pacific St. → Burrard St. Bridge
- W 4th Ave → UBC Entrance
- UBC Entrance → Fraser River Parkade
Each segment boundary corresponds to GPS-detected distance thresholds.
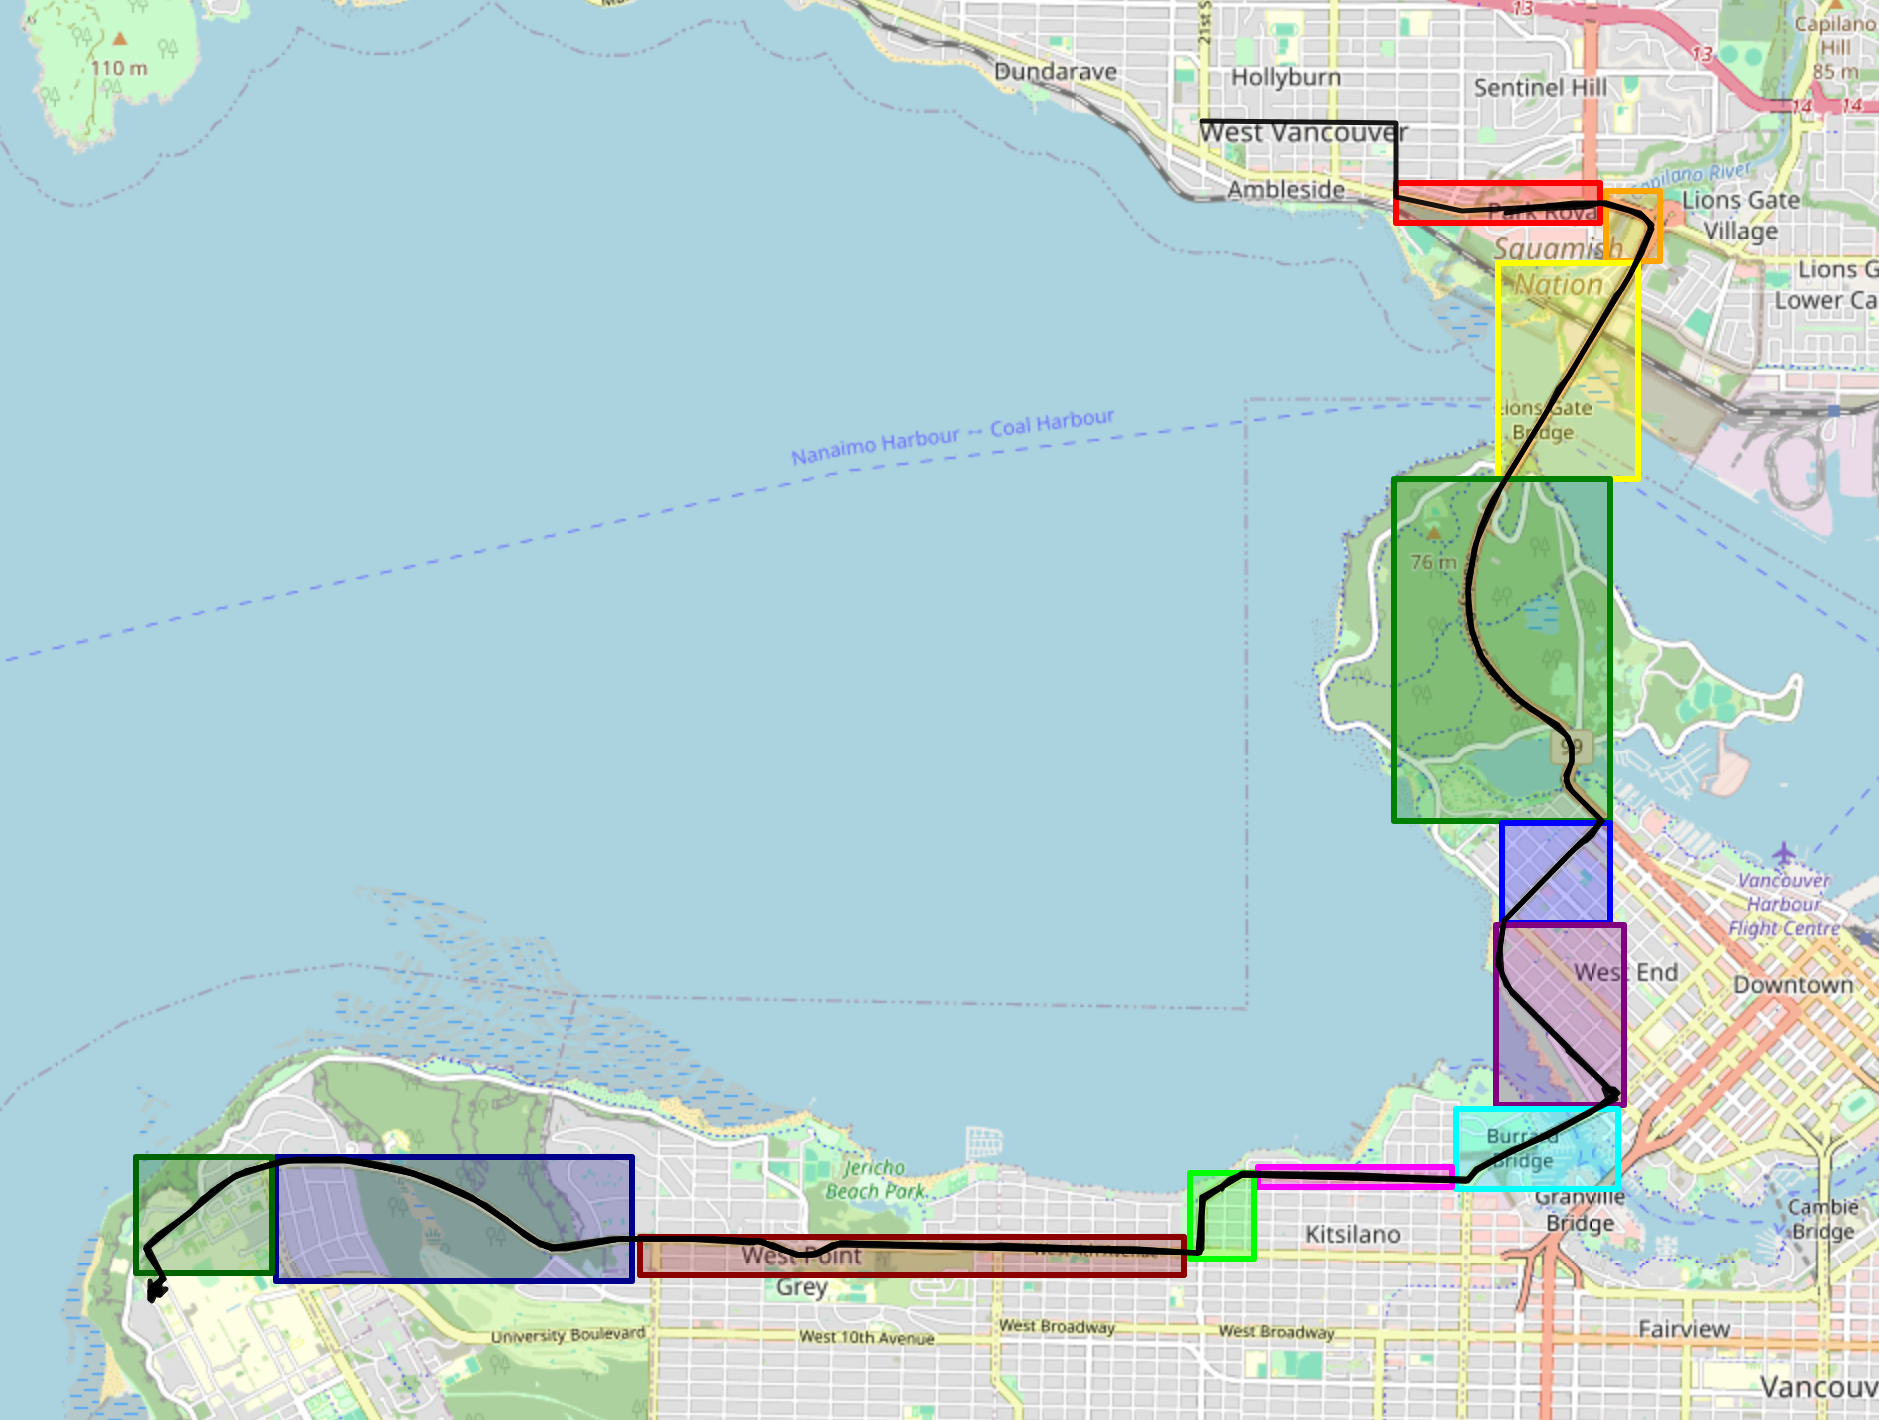 Map of the different segment boundaries.
Prediction Engine
The route model treats the commute as a series of independent travel segments. This minimizes outliers by segmenting delays, ensuring time and day of week specific delays are accurately represented.
Each segment stores:
- Mean traversal time
- Variance
- Smoothed historical average
- Last recorded duration
Example Model
void predictSegmentDuration(int* segment_id, ValidTraversal *traversals, int traversalCount, int targetYear, int targetMonth, int targetDay, int targetTime, int targetDOW, double* predictedMean, double* predictedStdDev) {
	double* durations = (double*) malloc(MAX_TRAVERSALS * sizeof(double));
	double* weights = (double*) malloc(MAX_TRAVERSALS * sizeof(double));
	int count = 0;

	// Collect durations and weights for the specified segment from array of all traversals
	for(int i = 0; i < traversalCount; i++) {
		if(traversals[i].segment_id == *segment_id) {
			durations[count] = (double)traversals[i].duration; // Store duration
			weights[count] = computeWeights(traversals[i], targetTime, targetDOW, targetYear, targetMonth, targetDay); // Compute and store weight
			count++;
		}
	}

	weightedMeanAndStd(durations, weights, count, predictedMean, predictedStdDev);

	free(durations);
	free(weights);
}
Major Fix
Originally, each segment prediction started at time 0, causing stacking errors.
The corrected version ensures each segment starts when the previous one ends.
Data Analysis & Results
Once all the prediction programs were working, I made a final data analysis function that produced a prediction for every minute of every day, that I could use for seperate real-time predictions.
Time: 06:28, Predicted Mean: 1634.11, Std Dev: 105.88
Time: 06:29, Predicted Mean: 1633.89, Std Dev: 106.11
Time: 06:30, Predicted Mean: 1633.67, Std Dev: 106.34
Time: 06:31, Predicted Mean: 1633.45, Std Dev: 106.57
Time: 06:32, Predicted Mean: 1633.24, Std Dev: 106.80
Time: 06:33, Predicted Mean: 1633.03, Std Dev: 107.04
Time: 06:34, Predicted Mean: 1632.82, Std Dev: 107.27
Time: 06:35, Predicted Mean: 1632.61, Std Dev: 107.51
Time: 06:36, Predicted Mean: 1632.41, Std Dev: 107.75
Time: 06:37, Predicted Mean: 1632.21, Std Dev: 107.99
Time: 06:38, Predicted Mean: 1632.01, Std Dev: 108.23
Time: 06:39, Predicted Mean: 1631.81, Std Dev: 108.47
Time: 06:40, Predicted Mean: 1631.62, Std Dev: 108.72
Time: 06:41, Predicted Mean: 1631.44, Std Dev: 108.96
Section of predictions for times around when I leave in the morning. (Start time, Predicted time in seconds, Std Dev)
All analysis was done via my c program and a small python script.
Data visualizations:
- Commute time for every minute of the day
- Commute time for the same time on different days of the week
- Commute time per segment
- Segment map to visualize above results
Further suggested visualizations:
- Total commute time vs. date
- Segment-level traversal time distributions
- Box plots of morning vs afternoon traffic
- Route animation using GPS points
Future Work
- Integrate real-time traffic data APIs
- Add weather + day-of-week predictor parameters.
- Explore ML models
- Build dashboard UI for live predictions
- Automate segment detection using clustering
- Improve hardware reliability & smoothing
- Add cloud storage + long-term trend analysis